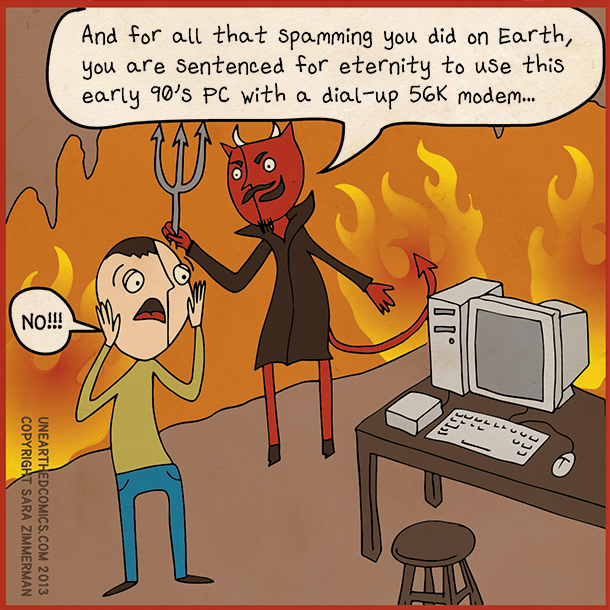
Interactive chart tells you how major tech companies make money, such as selling your data or using ads

If a company is not directly selling products or serving ads, sometimes it can be difficult to figure out how a company is making money. An interactive chart by Seer Interactive looks to help you better understand how major tech companies make money.

The chart, which is viewable from any modern Internet browser, displays roughly 40 tech companies and labels their revenue sources into six major categories:

  • Advertising
  • Subscribers
  • Lead Gen/Affiliate
  • Selling Data
  • Freemium
  • Royalties

Each tech company has its own little clickable circle on the chart (with some companies getting multiple circles, one for each different service of theirs) and clicking on a circle pops open a small box that tells you how that company makes its money and if it is profitable or not. For example, Mozilla makes money thanks to royalties it is paid by search engines; Apple makes money from apps through royalties and ads; and Google makes money from Gmail with ads.

Of course since dotTech did not create this chart we cannot verify the validity of all data, but quickly glancing at the data seems to indicate it is more or less accurate. However, much of the data provided by this chart is nothing groundbreakingly shocking; only data on a few companies is really “ohhhhh” — most of the data is “yeah, I already knew that”. Or maybe that is just how I feel.

Interestingly enough, only one company listed in the chart is marked as making money by “selling data” — LinkedIn. LinkedIn allows companies and recruiters to pay to access LinkedIn’s jobs recruitment center to hire LinkedIn members and that, according to Seer Interactive, qualifies it as making money by selling data. Some may argue that making money with ads is another form of making money by selling data but Seer Interactive doesn’t see it that way… maybe because Seer Interactive does a lot of consulting in the area of search engine advertising.

Despite its downsides, the interactive chart is interesting even if it doesn’t reveal anything mindbogglingly new. You can check out the chart from the link below.

Interactive chart on how tech companies make money

[via TheNextWeb]

Related Posts