Email article
Gantt charts are commonly used for work and project management. A Gantt chart basically shows the total amount of work done within a specific period of time. It helps you track your work progress and project milestones.
Speaking of which, there are specific types of software or project management applications with built-in support for Gantt charts. Now, what if you don’t have one? Well, in that case, you can opt for free online alternatives just like the one mentioned in this post.
How to create Gantt charts online
- Open your web browser. You’re free to use any web browser (ex. Chrome, Firefox, Opera, etc.).
- Next, go to the “Gantt Chart Creator” web-based application by Creately.
- Once you’re on the Gantt Chart Creator, you can see the working area together with a bunch of tools and options. Create a new document and then click “Templates” at the top toolbar to get started.

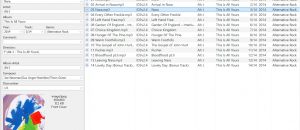
- On the Templates list, select “Gantt Charts” and then click the Gantt chart template that you wish to use. Click the “Use” option right below your selected template to confirm. For this guide, we will use a simple template that can be used for almost any type of project or task.

- After the template has been loaded, just click on any of the existing elements and objects. For editing texts and titles, just click on the text that you want to edit and then select the “Edit Text” option.
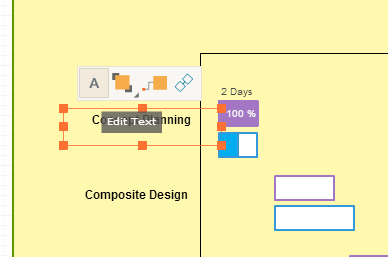
- For objects, just click the object that you want to edit and then click “Properties”. In the properties panel, edit the sections that you want to edit like the bar position, bar size, time unit, duration, completion percentage, etc.
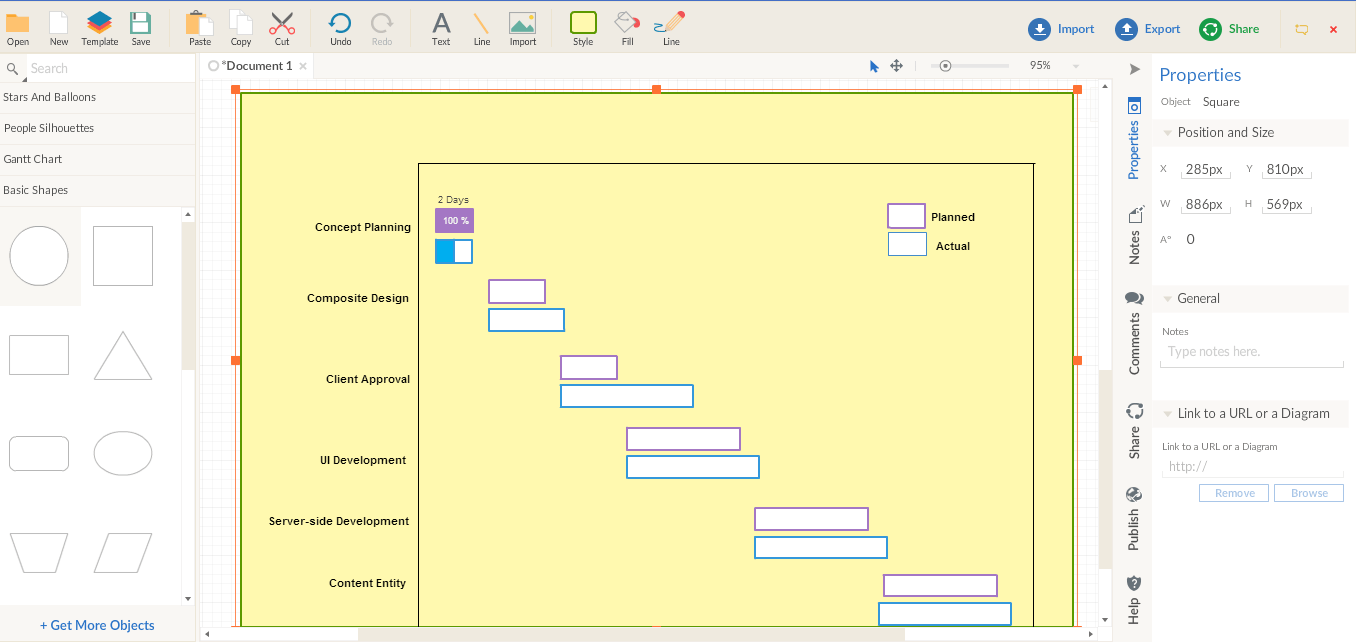
- Do keep in mind that the way how you edit the objects on your Gantt chart will usually depend on the type of template that you’re using. For simple Gantt charts, you would usually need to place at least two bars for each period, one for “planned” and the other for “actual”.
- So after you’re done creating your Gantt chart, just click the “Save” icon at the top toolbar to download and save your chart. Do keep in mind that you will be required to sign up or login before you can save your chart.