Email article
If the current form or layout of your Chrome history page isn’t enough to meet your needs of monitoring and evaluating your browsing activity, then you can choose to view your browsing history in a pie chart. Through the use of a visual presentation, you can easily determine the sites that you frequently visit during the last day, week, month and so on.
How to view browsing history in a pie chart in Chrome
- You’ll need to download and install a free Chrome extension called “Chrome Visual History”.
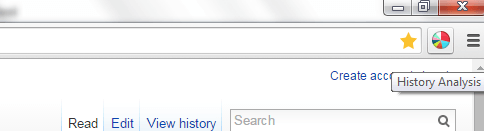
- After you install the said extension, take note of the pie chart icon on your browser’s toolbar (omnibar). It’s the icon for Chrome Visual History.
- Now, go ahead and browse those sites that you like.
- Once you’re ready to view a visual presentation of your browsing history, just click the pie chart icon in the omnibar.
- A new tab will automatically open and it will load your browsing history in the form of a colored pie chart.
- It will show at least four pie charts so you can monitor and evaluate your browsing history for the current day, for the current week, month and all time.
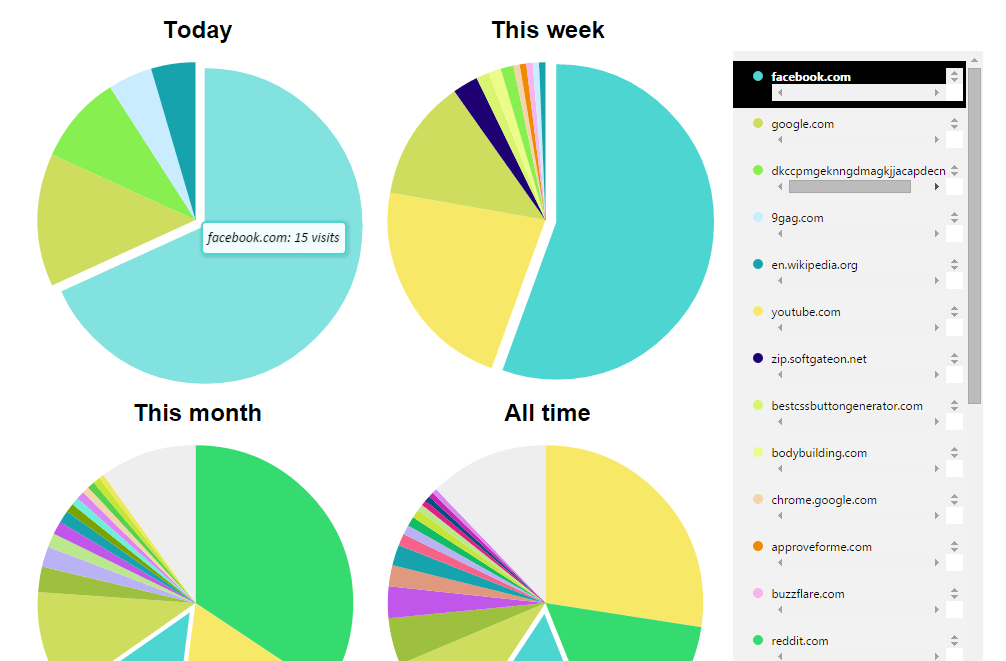
- Just hover your mouse over the different slices or sections of the chart to know the sites that you’ve visited.
So that’s it. You can even opt to take a screenshot of your visual history page for documentation purposes.