Email article
Outline indicators are handy for Calc spreadsheets with lots of data in them. An outline indicator is a tool with which you can collapse or expand rows of data. So with outline indicators you can temporarily remove rows from spreadsheets by collapsing them.
Open OpenOffice Calc, and click Data on the menu bar. Select Group and Outline and click AutoOutline. That will add auto outline tools to the left of the window as below
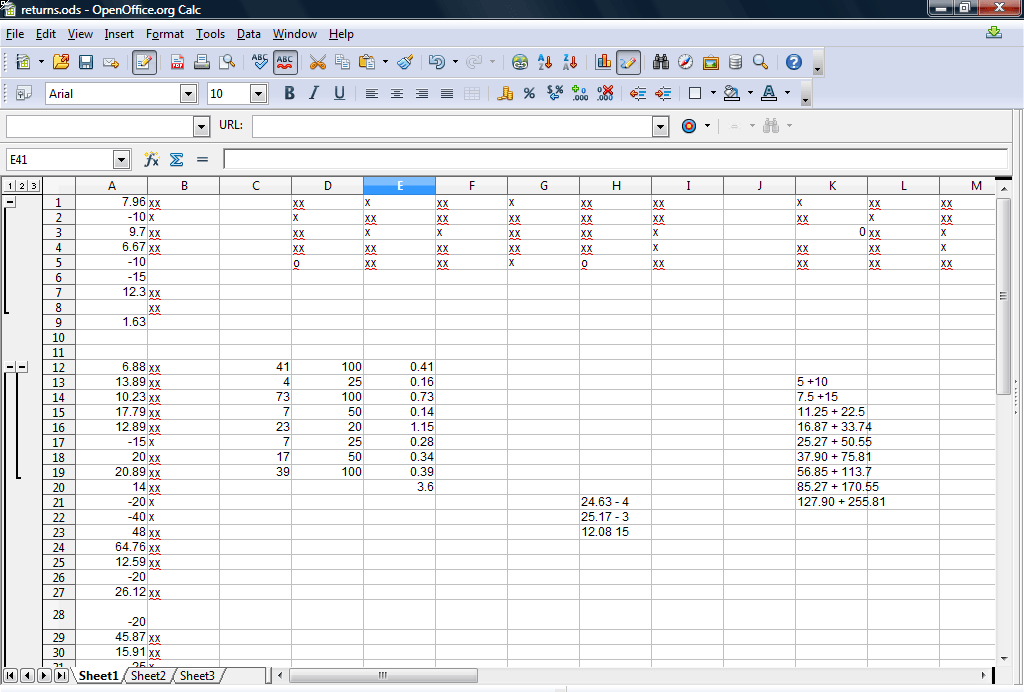
Now you can click on the – button to close a group of rows. That removes the rows from the spreadsheet as in snapshot below. This effectively minimizes the row data.

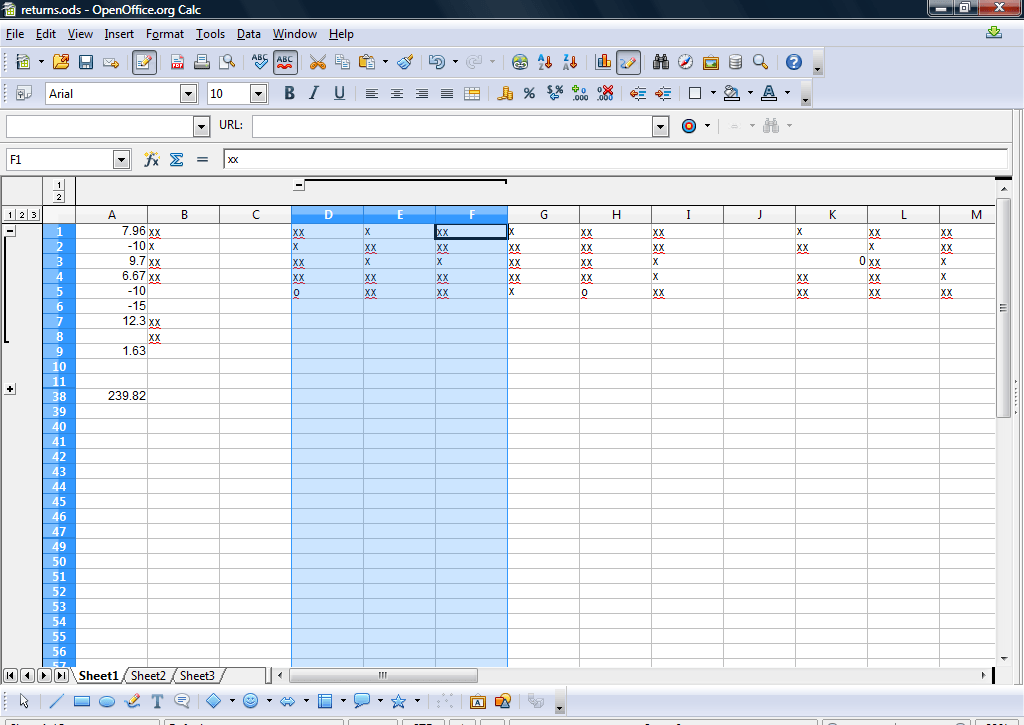
You can always restore the rows on the spreadsheet by pressing the + button. Alternatively, click the numbers at the top of the AutoOutline column to minimize and maximize spreadsheet rows.
To add your own groups, select some rows on the spreadsheet. Then select Data > Group and Outline and Group. That will add an outline indicator the spreadsheet. You can remove the outline indicator by selecting the rows and Ungroup from the Group and Outline submenu.
Note that you can also add outline indicators to columns. Select a group of columns, and click Group from the Group and Outline submenu. That will add a column outline indicator as below.
To remove all outline indicators from spreadsheet, open the Group and Outline submenu. That includes a Remove option on it. Select that option to remove outline indicators.
Outline indicators are a great tool to condense Calc spreadsheets with. With them you can now temporarily remove groups of rows and columns from spreadsheets.