Email article
There are tables on plenty of websites. However, most browsers don’t include any options for HTML tables. With the TableTools2 Firefox add-on you can set up graphs for website tables, copy, sort and filter the data.
This is the TableTools2 add-on page that you can add it to Firefox from. Press the green button on that page and restart Firefox to install it. Then open a website page with a table on it.
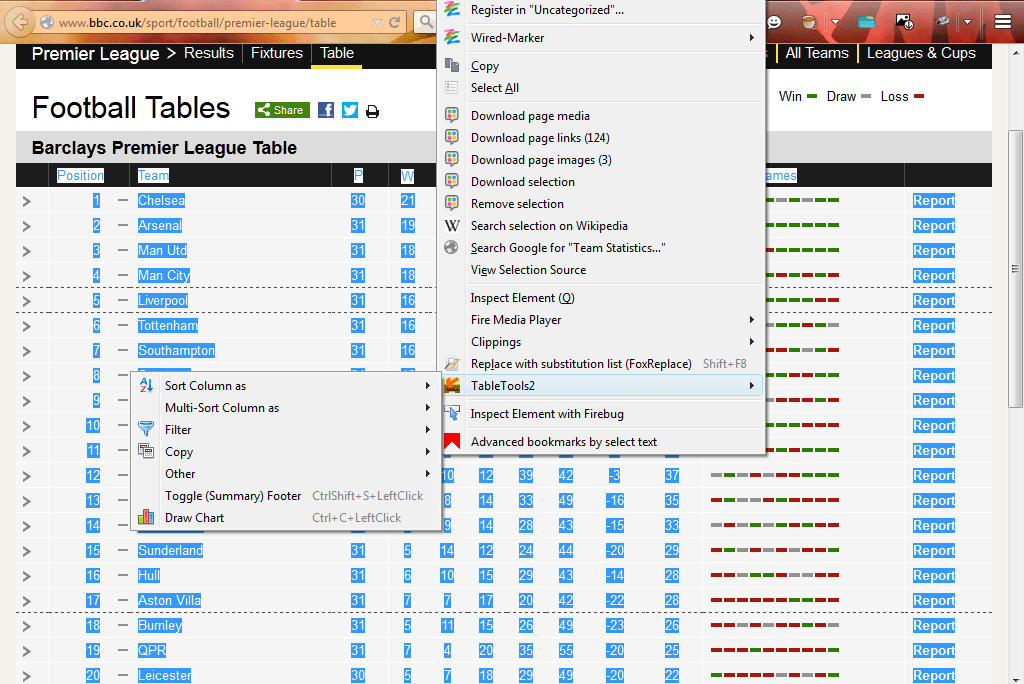
As an example, open this table on the BBC website. Drag the cursor from the top left corner of that table to the bottom right to select all the data. Then when you right-click, you’ll find a TableTools2 submenu on the context menu.
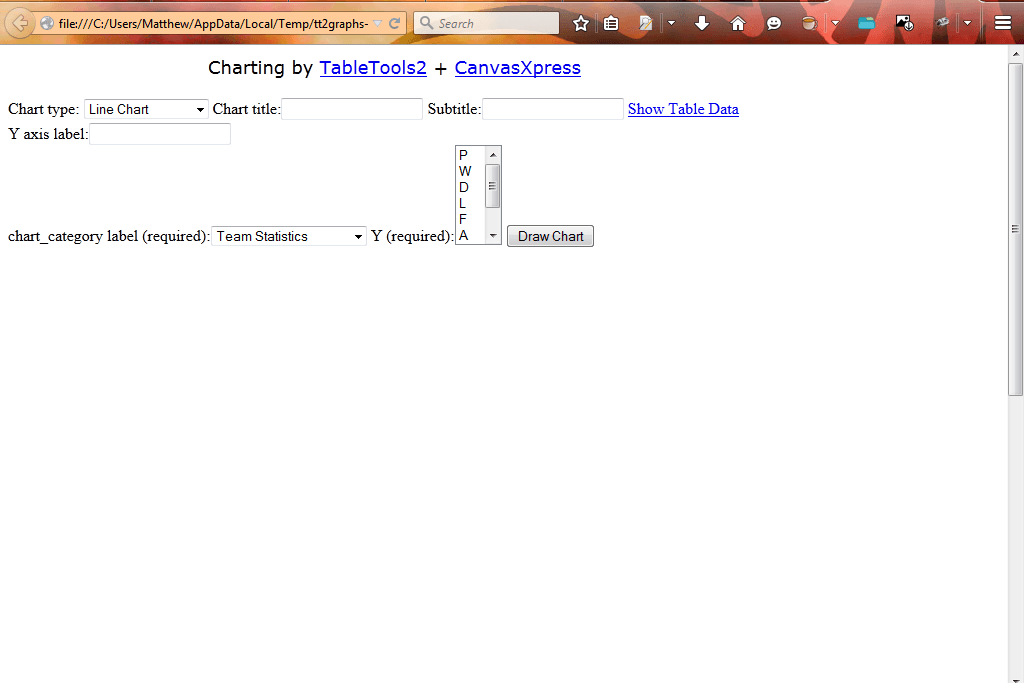
Select TableTools2 and Draw Chart from the submenu. That opens the tab in the snapshot below. Select Chart type to choose a graph for the data. Select Line Chart from that drop-down list, and enter “League Table Line Graph” in the Chart Title text box.
 Select Team from the chart_category label (required) drop-down list. Then select Pts from the Y (required) drop-down list. Press the Draw Chart button on that page to set up the league line graph as shown in the shot below.
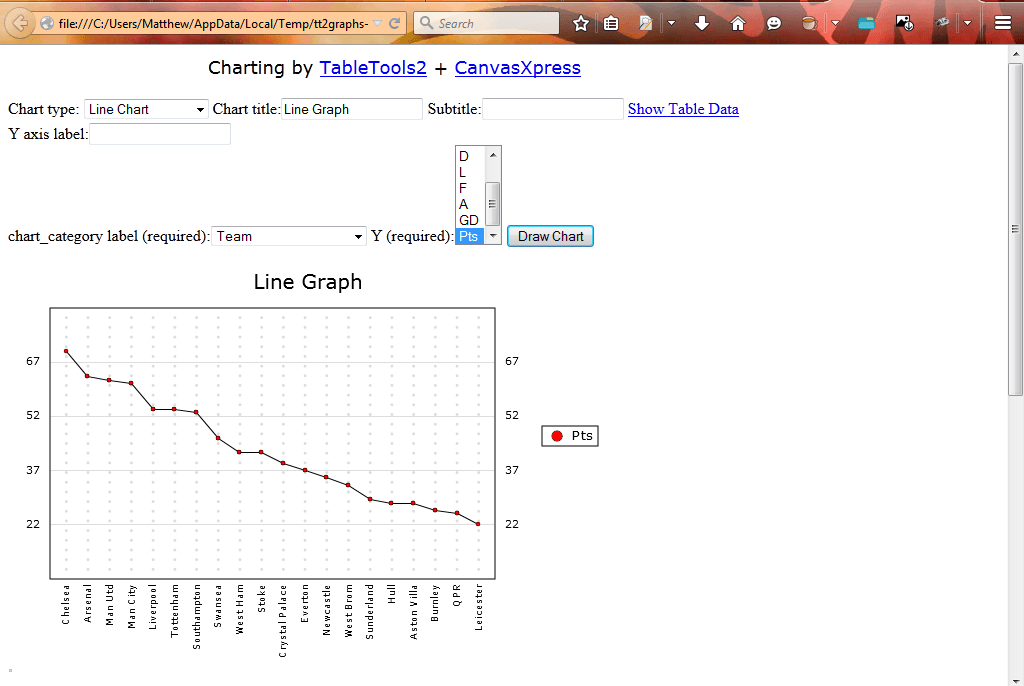
So now you have a league table line graph that shows you the point totals for the teams. With this add-on you can also set up pie charts, histograms, scatter charts and bubble charts.
This add-on also includes filter options. With those options you can filter table data. Select the data in table, right-click and select TableTools2 from the context menu. Then select Filter > Toggle Dropdown Filter to add drop-down lists to the top of the table as below. You can filter dat by selecting it on the drop-down list. For example, selecting one of the teams from a league table drop-down list will filter out all the other sides.

For further add-on options, click Open menu and Add-ons. Press the Options button beside TableTools2 to open the window below. There you can edit the add-on’s filter, combine and copy hotkeys by clicking the Filter/Combine/Copy Shortcuts tab. Click the Other Shortcuts tab to customize the other add-on hotkeys.

So now you can transform HTML tables into a variety of graphs. Plus the add-on also has handy options for filtering, sorting and searching data. Check out the add-on’s website that includes TableTools2 video demos.