All the Mac users don’t know about the Mac activity monitor, and only a few understand its working and what the purpose of it. The Activity Monitor helps you to manage your Mac system’s memory, troubleshoot issues and fix the problem of slow applications. Launch the Activity Monitor of your system and when t is launched you will see that the screen of Activity Monitor is sectioned into two parts: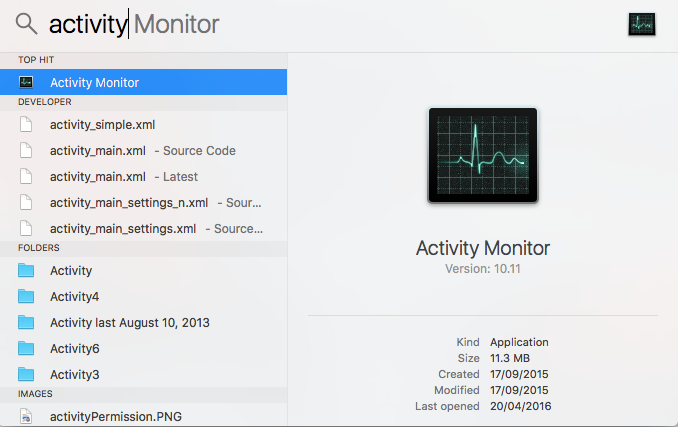
1. The Processes Table
The main tab displays a list of system processes and the applications that are opened. Some of the processes are easy to view, and others that are running in the background are not usually displayed. The details of all the processes are listed in the specified column.
2. System Monitor Tabs
CPU, Energy, Network, Memory, and Disk are the five category tabs that are displayed at the top of the Activity Monitor. Let’s assume if you want to have a look that which processes are using the system RAM then you have to click on the tab named as Memory and same is for others.
CPU: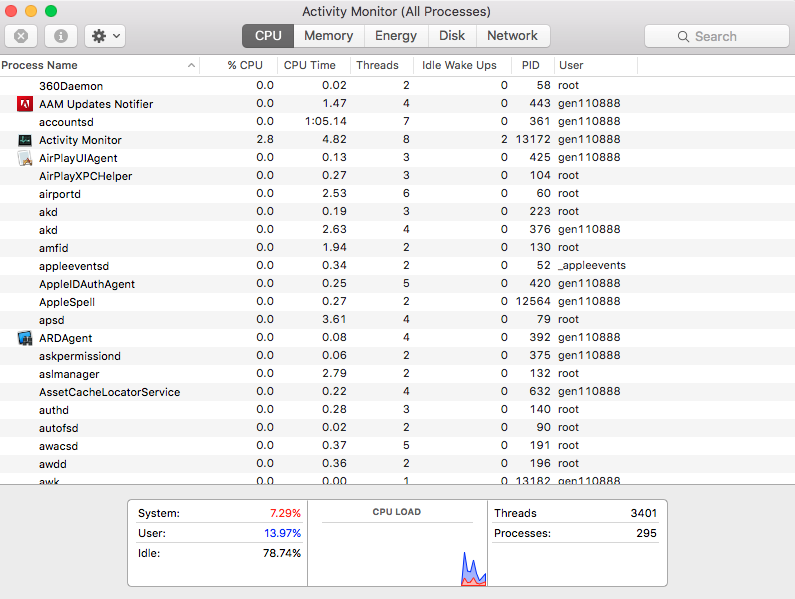
The CPU tab displays that how the processes are using your system’s processor. You can view that what percentage is utilized by a process, how long it has been active and other information related to that process. To have a look that which apps are using the most of the CPU, open Activity Monitor and select view all processes option. The problematic processes are displayed in red text saying Not Responding. If the process is “Not Responding” then waits and checks that if returns to normal operation or it crashes. Else terminate the process by clicking on the process and select the option of quit process. If you want to stop any process then click the cross button.
Memory: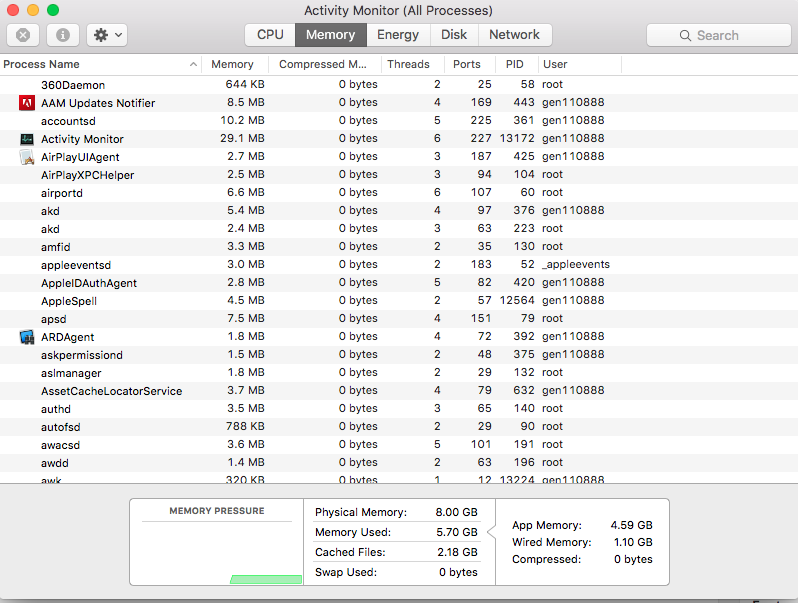
The Memory tab displays the information that how much the RAM is being used. You can view the information at the bottom of the Memory tab. The value of Memory is useful here as this will display the total amount that is being used by different apps on your system and is divided into Wired, Compress, and App Memory. The graph will display the memory that is used y different apps and processes.
Energy: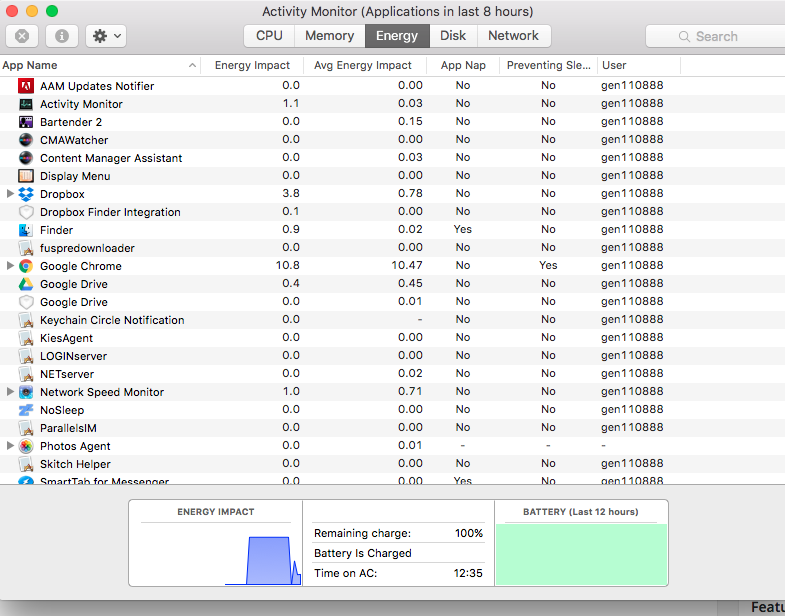
This tab is very helpful for laptop owners as it displays that how much battery of your system is being utilized by the app and processes. The system will have a low battery life if your computer is consuming more energy. If the battery life is getting shorter, then check the column named as Average Energy Impact to see that which apps are using more energy. If you don’t need any of the apps that are consuming power, then quit them.
Disk: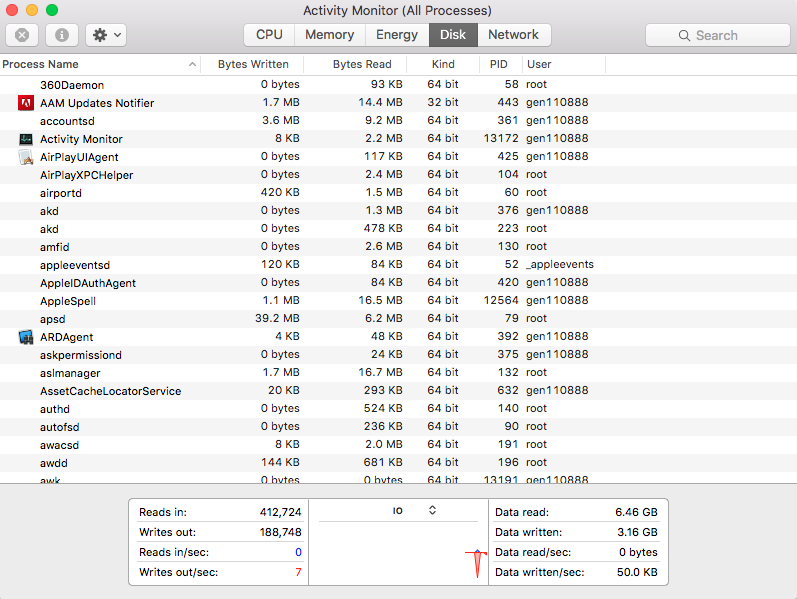
The Disk panel shows that how much data your processes are reading from and writing to your drive. It also displays the number of read-ins and write-out (IO), which is the number of times your system accesses the drive. If space on, the hard disk is getting shorter than it can cause problems on your system. If space is getting shorter than 10GB, then this is the perfect time to free some space.
Network: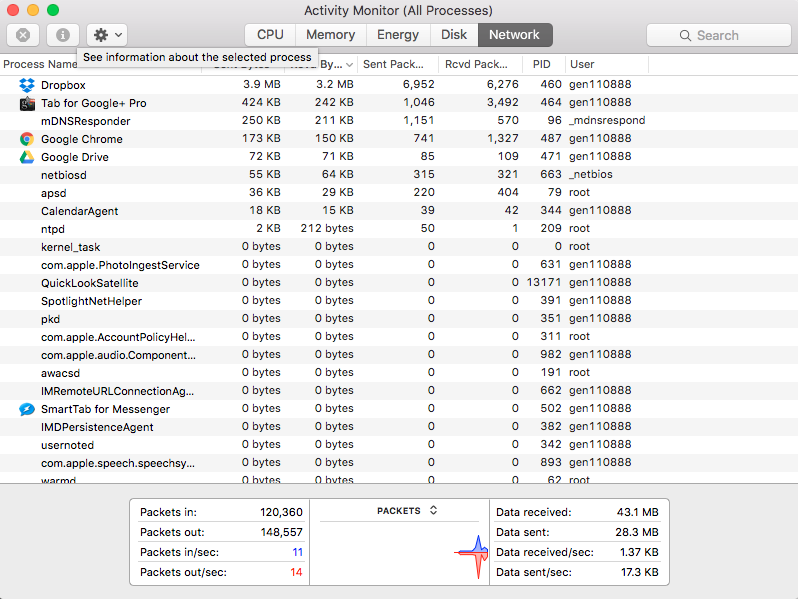
The Network tab displays that how much data your system is sending or receiving using the network. At the bottom of the tab, the information regarding network usage and data amount is displayed.

 Email article
