Do you often find yourself working on online presentations that include charts? Now, what if you need to embed your chart to specific websites or blogs? Is there any way for you to do so without going through a lot of hassle?
Well, there is. All you need to do is to read and follow the steps listed below.
How to create embeddable data charts online
- On your web browser, click here to go to “Datawrapper” – an open-source free web application that lets you create embeddable charts. With this web app, you can create line charts, bar graphs, pie charts, etc.
- Once you’re on Datawrapper, you have the option to try it out first before you register.
- So go ahead and click the “+New Chart” option at the top menu.
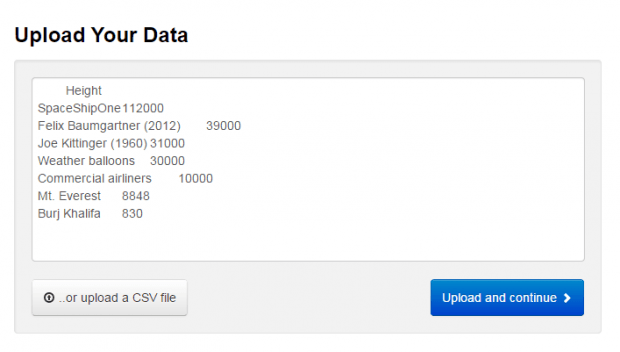
- You will then be asked to copy and paste your data. Alternatively, you can opt to upload a CSV copy of your data. Click “Upload and Continue” to confirm.
- Next, do not forget to check and describe your data. Just click on the columns to make some changes. Once you’re done, click “Visualize”.
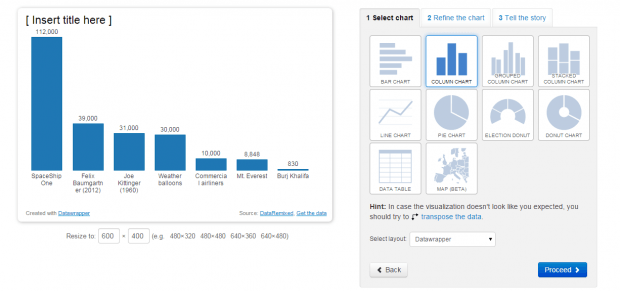
- In “Visualize”, you will be asked to select the type of chart that you want to use for presenting your data. You can select a line chart, pie chart, etc.
- Click the “Refine the chart” tab to customize the appearance of your chart.
- If you want to update your chart’s title and description, click the “Tell the story” tab. You can also indicate your preferred chart size. The default is 600 x 400 pixels. Click “Publish” once done.
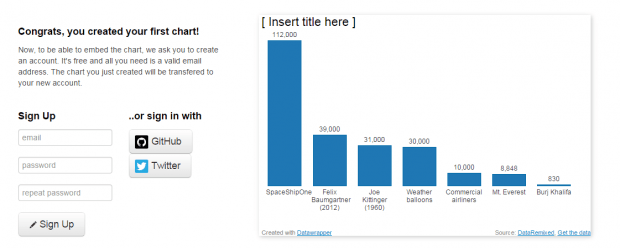
- Now, you’re all set to publish and embed your data chart to any site or blog. However, keep in mind that you cannot copy the embed code for your chart unless you log in or register at Datawrapper.
So that’s it. With Datawrapper, you can create all sorts of embeddable data charts. These charts will certainly come in handy for business proposals, meetings and presentations.

 Email article
