Email article
As you add more pages to your bookmarks they might get a little disorganized. To organize your bookmarks, an infographic-style visual report might come in handy. You can add exactly that to Google Chrome with the Gleana Bookmark Infographic extension. That generates an infographic report for your bookmarks providing details for folder structures, top domains, folder numbers, bookmark numbers and more besides!
Open this page and click on the + Free button to add the extension to Google Chrome. Then there will be a Gleana Bookmark Infographic button on the toolbar. Click on that button to open the report page tab in the shot below.
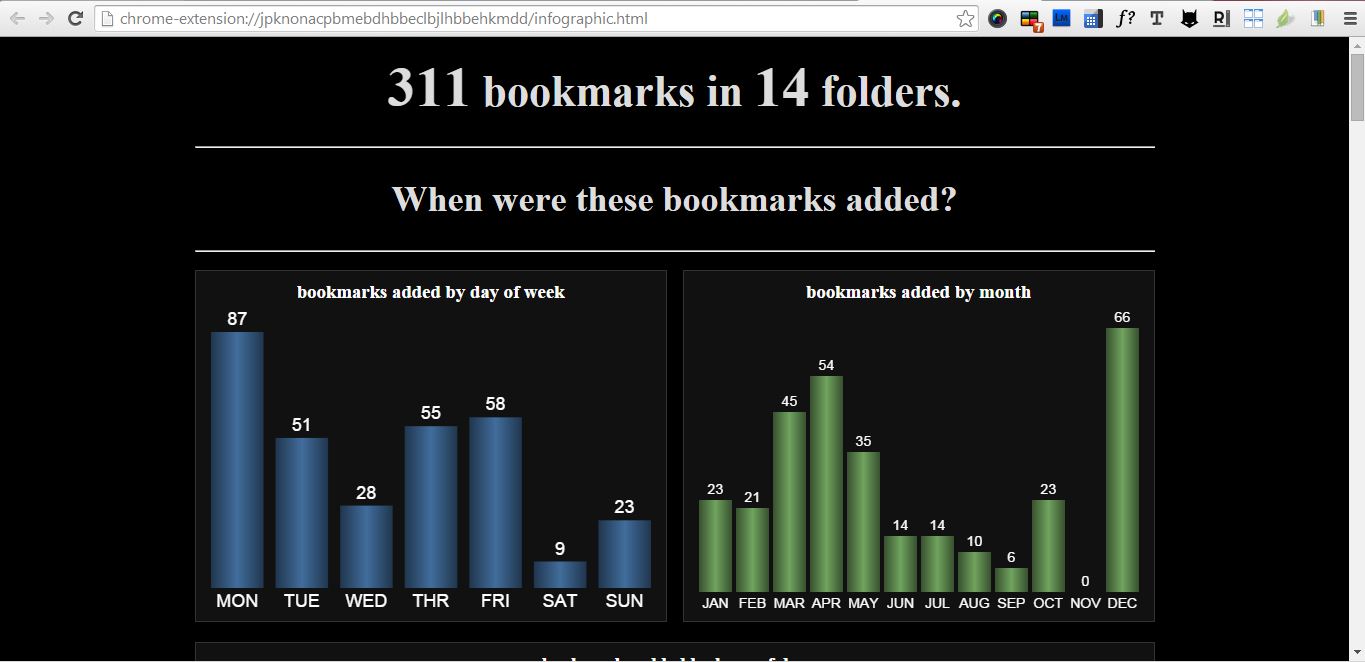
The first graphs on the page, in the shot above, show when you added pages to the bookmarks. The left bar graph shows how many you added on each day of the week. The bar graph on the right shows you how many pages you added to your bookmarks each month. Below them there is a bookmarks added by hour of day graph.
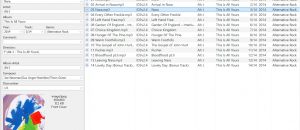
Scroll down a bit to the growth over time graph in the shot below. Each color band in that graph shows you a folder’s size. Click on a band to isolate, and again to reset.

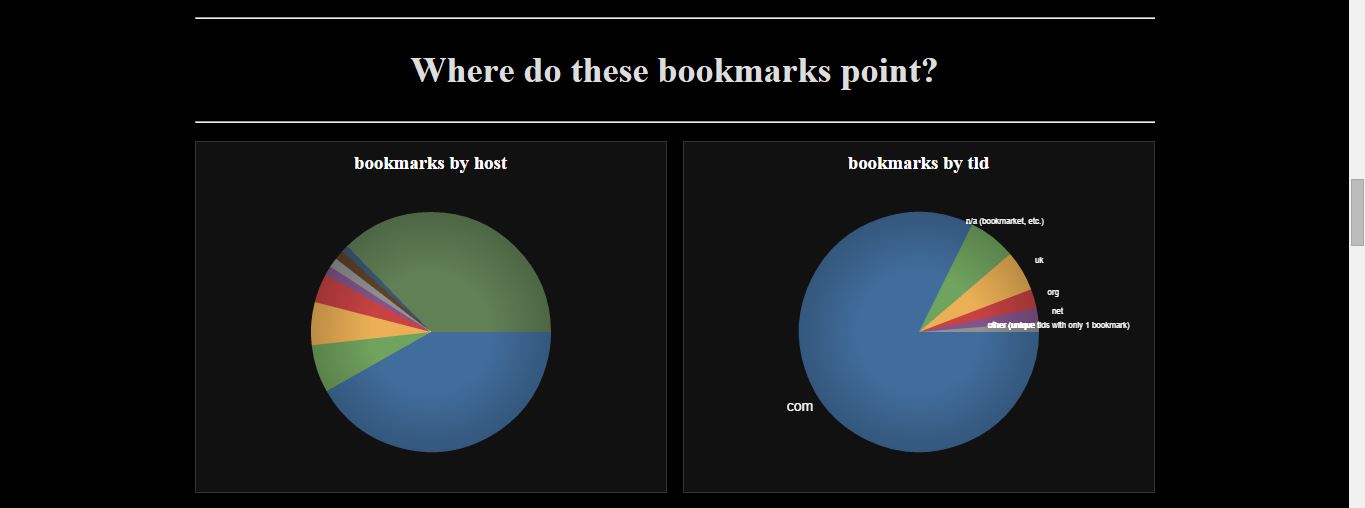
Next on the page are a couple of pie charts. The graph on the left shows you the bookmarks by host, and the websites you have bookmarked the most. On the right is a pie chart that shows you the percentage of tld bookmarks such as .com, uk, etc. Hover the cursor over the pie chart segments for further details.
Near the end of the page is a diagram that shows how your bookmarks are organized. Each oval is one of your folders. The size of each of the ovals indicates how many bookmarks there are within the folders.

The Glena Bookmark Infographic graphs gives you an interesting overview of your bookmarks. They might also come in handy for reorganizing Google Chrome bookmarks.